
1 minute

Do you value data? Of course you do, otherwise you probably wouldn't be subscribed to this blog. So my guess is that you appreciate data without bias. In this age of "Fake News" and other obstructions to our desired level of information quality (think broader than data quality) we have to be weary of how information is interpreted and whether the data we use, to draw a conclusions, is without bias.
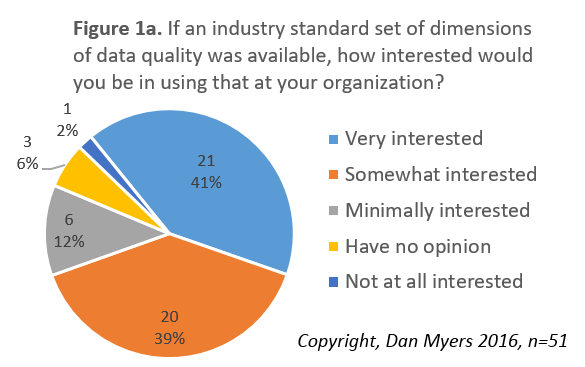
One example of this is the chart (above) developed for the Annual Dimensions of Data Quality survey that we host. As seen in the bottom right corner of the chart, a string of text says "n=51". This means that there were 51 survey responses that provided the basis for this statistic. In 2015, when we first conducted this survey, we received 136 responses to the survey which made us feel much more comfortable about the conclusions we made.
So what does this have to do with me? Well, at DQMatters, we're all about quality and reducing any bias. It's just in our DNA so to speak. Right now, the 2017 Annual Survey of the Dimensions of Data Quality is open (April 1st to 30th, 2017) and we need many more survey responses in order to meet our goal of increasing the year-over-year respondent count. Your survey response MATTERS. Only you can help us reduce any bias in our research by taking the survey now. Thank you in advance.
The survey is now closed. Thank you for your assistance.