

This summer I took a working vacation to San Diego, California. Having spent a week there each year, for many years, I was impressed with the significant increase in number of app-based transportation rentals available all over the streets. In the past, the city has experimented with docked transportation options, but they didn’t seem to be widely used. This year, both bikes and scooters were all over the place, and so I just had to try both.
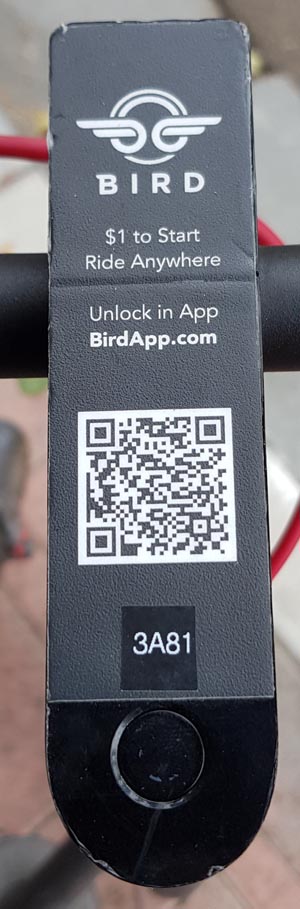
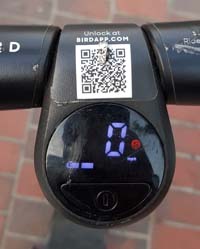
Each scooter has basic instructions on the scooter (see picture on right). This one (right) is from the vendor named Bird, which seems to be the predominant vendor, but Lime also had a lot of eScooters and bikes available as well. If you scan the QR Code with your phone, the associated URL is displayed (e.g. https://ride.bird.co/<some unique hash here for each scooter>). This redirects to the Google play store fordamaged-qrcode-example.jpgdamaged-qrcode-example.jpg download. Sometimes there is an adhesive label at the bottom with the scooter ID (e.g. 3A81). Perhaps they could add "Scooter ID:" so that users understand how to use this.
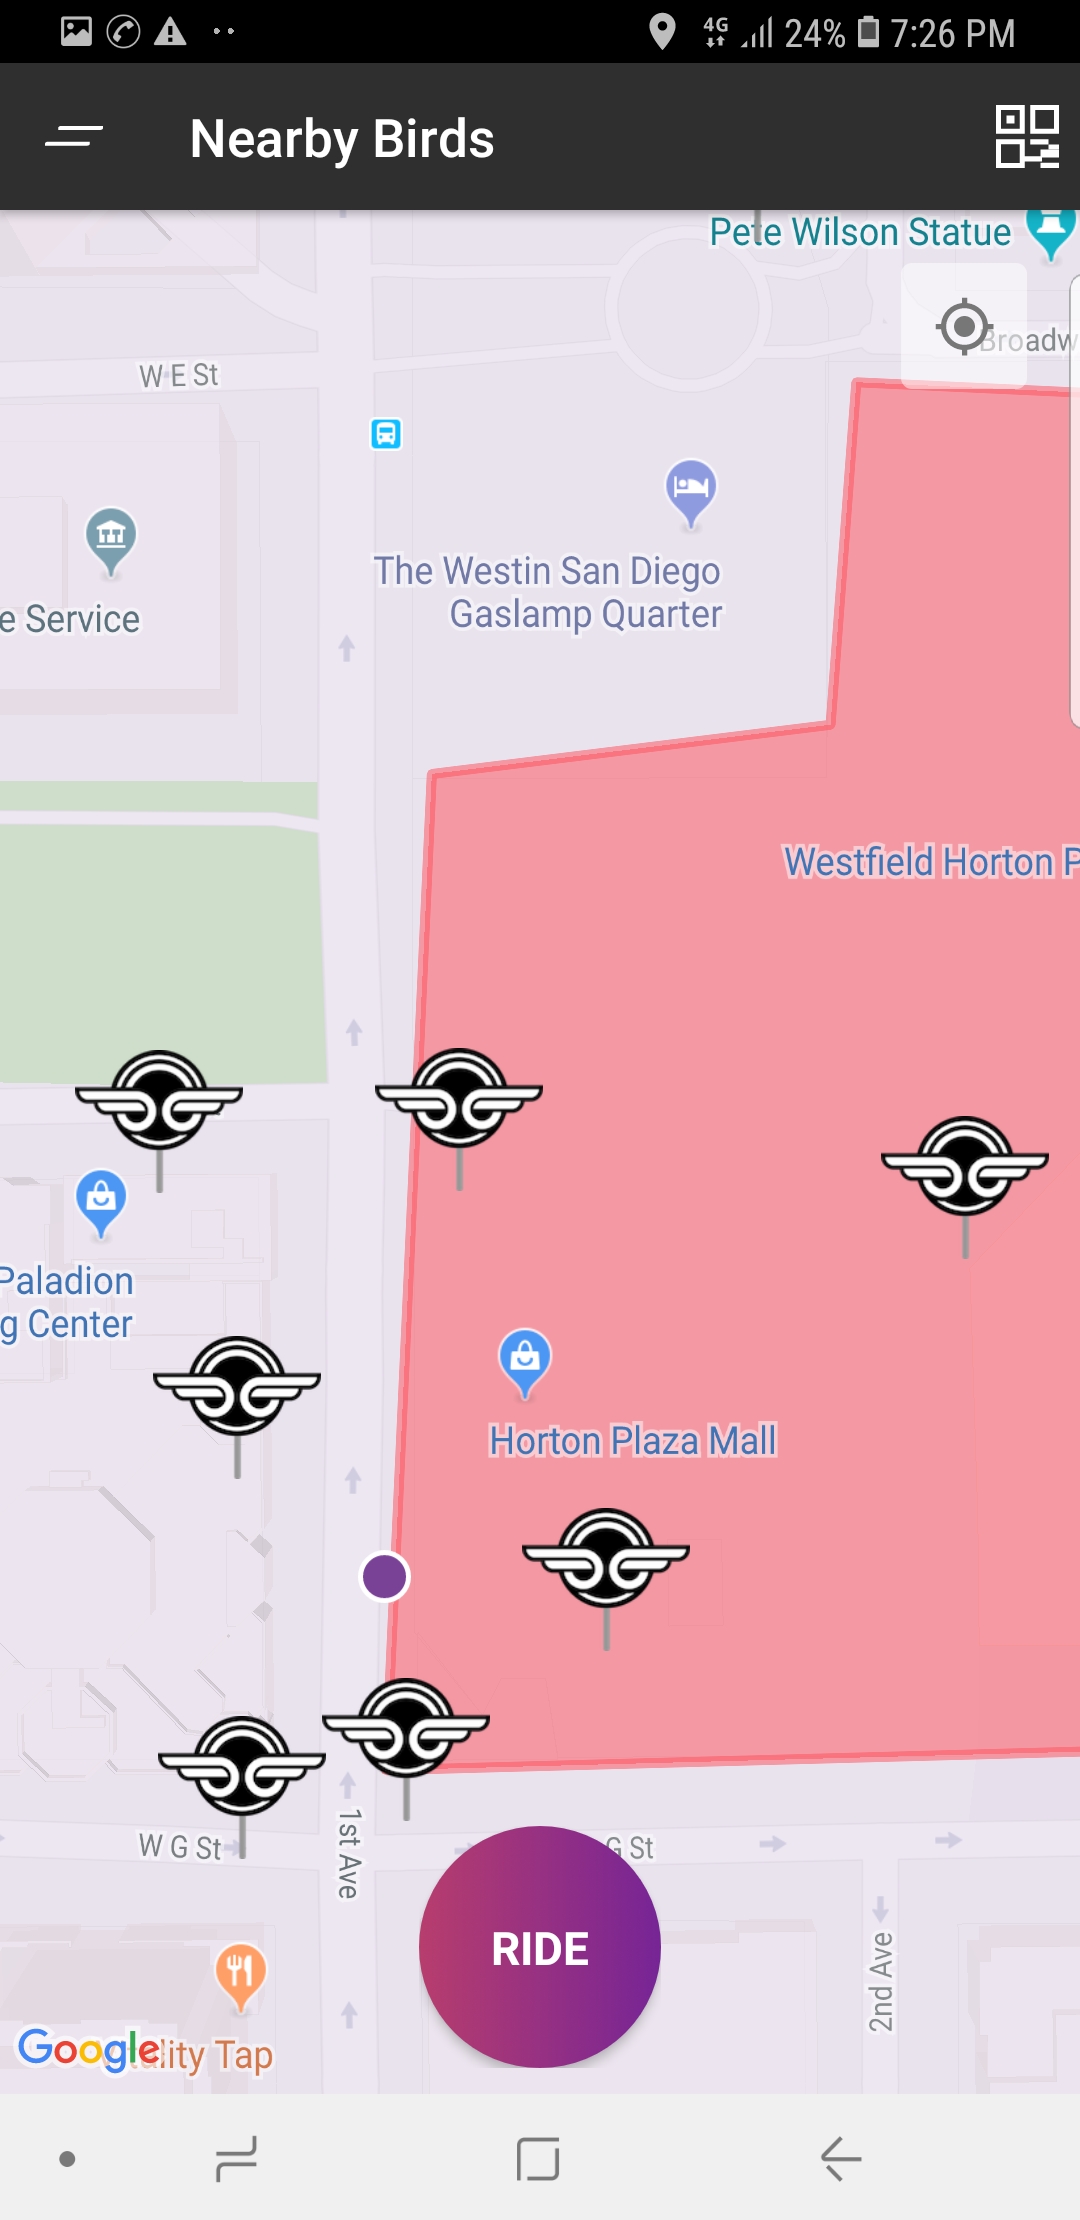
In the picture (right), you can see a map of scooters available for rent according to the Bird app. But what did I find? The first scooter I tried to find wasn’t there (showed up on the map but wasn’t physically at that location). At other times I found scooters, but after comparing my location with the map in the Bird app (no scooters were available to rent at my location).
Scenario 1. When the scooter is on the map, but not at the location. (Timeliness- Electronic Float)
Discussion. Typically, this is caused when the map doesn’t show the location of the scooter at the current time, but where it was at some prior point in time. We can use the Timeliness dimension to measure whether the map system has the most up-to-date version of the data using the Underlying Concept called, Electronic Float. This happens when the record of GPS data about the location of the scooter is still on the scooter (perhaps in memory) but not yet transferred to the Bird application's database, maybe because the battery died. If the location isn't recorded because the battery died, then we'd say this is a Completeness issues, covered by the Underlying Concept of Existence.
Additionally, I see that on the map, the proprietors of the Horton Plaza have apparently refused access to the scooters (designated in the app map through use of a different color polygon covering the shopping center and label). I do see that despite this rule, there clearly are scooters on the premises (right). This looks like a good opportunity for public entities and proprietors to measure unwanted use of scooters on their property.
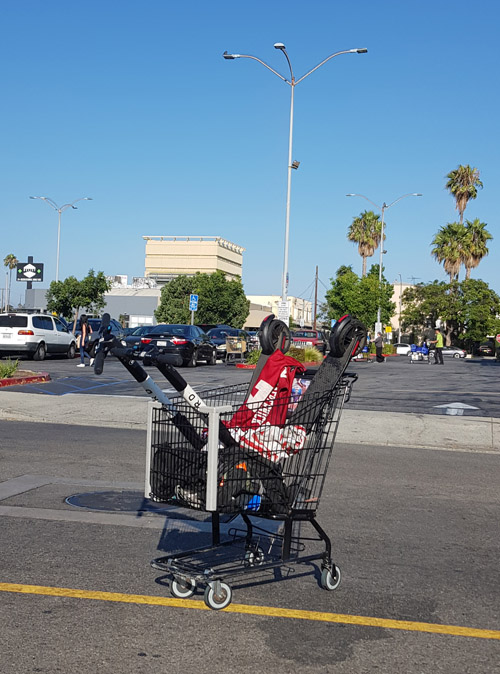
It should be noted, however, that even though the scooters may be present within a no riding zone, they may not be in use at the time. During a recent trip to Loss Angeles, I found a man transporting scooters in a shopping cart across the middle of a large street (see picture below). Clearly the scooter position doesn't provide the whole context regarding the status of the scooter.
Non-standard Scooter Location/Transportation
As a customer, one of the most frustrating experiences is when I couldn't find a scooter nearby. Then at other times you find one, but it isn't on the map. Scenario 2 is an example of this.
Scenario 2. Scooter on street, but not shown on map. (Completeness- Existence)
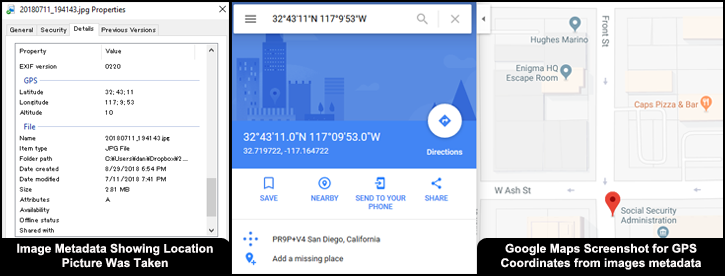
As you can see in the image (below) a scooter is available at the corner of Ash St and Front St, but the map doesn't show that fact.
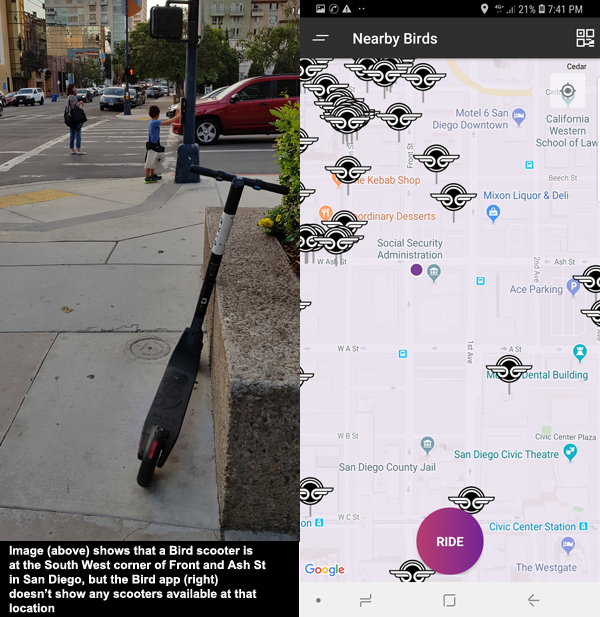
Below you can see the image metadata with the GPS (lat/long) and that location mapped on Google maps to verify the location and time that the picture was taken.
Discussion. This typically happens when a scooter is out of service (company isn't advertising its location because the battery is dead or it has an internal malfunction that prevents a rider from using it). We discussed this above in scenario 2, identifying the Completeness dimension and Underlying Concept of Existence. What is the recommendation? Service trucks should pick it up as soon as possible so as not to disappoint customers. Bird has begun a program that enables scooter users to charge the scooters- and get paid for it- called the Bird Charger community, so hopefully this will also reduce the number of uncharged scooters that appear available on the street.
Business Impact. Decreased sales are experienced when users can’t find a scooter. Or even more frustrating, can't rent one that they see right in front of them. To the extent that poor data quality can be traced to these lost sales, we can successfully document the cost/importance of a strong data quality program in order to run a successful business.
Scenario 3. Scratched QR code on scooter prevents user from scanning it (Representation- Media Appropriate).
 Business Impact. Users get frustrated, give up or even worse, pick a competitor’s scooter nearby when they can’t use your company’s scooter.
Discussion. Representation (how easily the data is understood by the consumer) is often considered in terms of charts and graphs but in this case the way that your smartphone reads the QR code depends on the scan-ability of the code and if that is damaged (as seen in the picture) consumption is very hard. This is an example of the Representation dimension’s Underlying Concept of Media Appropriate. A simple DQ metric that we might use could be a simple categorical measure of how easily the media is can be damaged/vandalized causing a poor end-user experience. This might be as simple as a “Physical media damage index” composed of three categories of EASY, AVERAGE, and HARD, defined as follows.
Possible DQ Metric. Physical media damage index
Possible Values: EASY, AVERAGE, HARD.
Definition: This is a categorical index of how easily the physical medium is damaged (or vandalized).
Possible Metric Formula:
- Easily damaged= only requires accidental touch (less than 1 foot pounds of force have to be applied to make the media unreadable).
- Average likely damaged= when 1 to 15 pounds of force have to be applied to make the media unreadable.
- Hard to damage= when greater than 15 pounds of force have to be applied to make the media unreadable.
Conclusion.
In summary, electric scooters are very handy and, when available, serve a both tourist and busy city commuters well in San Diego, but data quality hurdles still exist. We discussed scenarios when scooters show up on the app maps, but can’t be found on the street, or cases when they are parked on the street but don’t show up on the map. Lastly, we discussed a unique data quality situation experienced when the physical media that holds data is damaged. If your organization deals with physical products (e.g. consumer packaged goods, equipment, durables…etc.) please consider this dimension and associated metrics proposed here.