

From January 23-25, the Los Angeles Homeless Services Authority (LAHSA) conducted their annual count of unsheltered homeless with the help of more than 8000 volunteers. On the evening of the 24th, I joined the #TheyCountWillYou effort in Los Angeles to count the homeless in the city of Cudahy. As you’ll see in the description of steps conducted the process is thorough and intentional. I was proud to be contributing in a small, but important way, by helping out. If you live in the greater LA area, I recommend you participate next year.
In this blog, we'll discuss the current homeless survey process, and describe how data quality might be improved in the future.
At a high level, the following steps outline the process that the Los Angeles Homeless Services Authority uses during the count.
- Market the event through various channels (Website, prior year participants, radio...etc.)
- Require RSVP via website- allowing volunteers to choose their preferred survey site
- Meet at deployment location
- Sign waiver form
- Watch educational video and take a quiz about how volunteers should collect data
- Form counting teams of 2-4 persons (nobody goes alone) and take picture of all volunteers
- Go out and conduct count (on foot and driving)
- Return to deployment location and submit results to validators
- Receive certificate of appreciation
Now obviously this review is relatively high level given that I only participated in the count as a volunteer, but from the outside looking in I found a number of examples of data quality controls that could be implemented in order to ensure higher quality data. First and foremost, if the count could be conducted with digital input of data (e.g. by tablet or smart phone) the following validations could be conducted.
- Manual typos could be avoided, thereby improving data Validity
- Reference data (such as the Deployment Site Coordinator/Phone), Date (using system date), Departure Time/Return (when date-time used in conjunction with GPS position).
- Survey Count Data (e.g. homeless individual count) because data would no longer need to be manually typed into the website by the Validators (County employees tasked with inputting results after volunteers return from the count)
- Spatial data precision could be added using GPS position
- Timeliness of data upload to LAHSA could be improved
- Completeness validation conducted for all data fields in general as well as spatial completeness measures used to ensure that all streets assigned were driven/walked
The list of attributes on the right is the extent of the data currently collected on the paper forms. The 2017 dataset listing all data collected by LAHSA for the survey can be downloaded here (including metadata). | 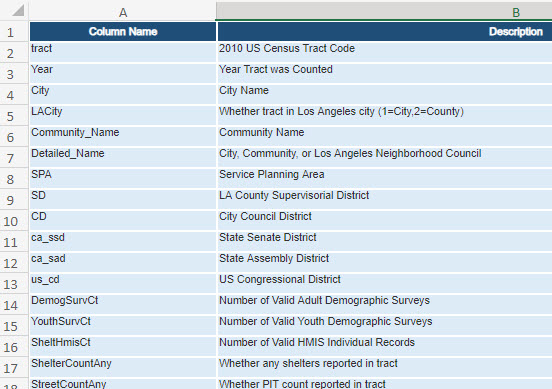 |
There are at least two ways to improve the data quality of the survey data. Note that although these two options are discussed separately, they aren’t necessarily mutually exclusive. Continuous improvement typically includes both incremental steps and bigger technology focused changes.
- Reactive & Process Focus- Post Collection Profiling & Process or Training Related Improvements
- Proactive & Technology Focus- Proactive Control Through Digital Collection of Data (aka using Smartphone/Tablets)
In the Reactive & Process Focus, all collected data could be profiled using software tools (proprietary or open-source depending on the funding available). This is likely already done, but surely additional business rules, expectations for quality levels and governance could be documented and improvements made for a relatively small investment in time and computing resources. The following are a few observations about where to start this effort.
Discuss what types of analysis are going to be conducted by stakeholders using the data- documenting quality levels in terms of dimensions of data quality (preferably the Conformed Dimensions). Then run profiling on data collected to evaluate gap analysis between expectations and actual data quality levels.
- These findings should be communicated to the stakeholders and future remediation prioritized
- With priorities in hand, process and training changes need to be made in order to ensure the most impactful improvements. This might include:
- Enhancing the survey design (how the survey is conducted). All surveys have room for improvement; (this is an ongoing effort over time).
- Training volunteers beforehand with required web-based training
- Designing levels of mastery requirements for volunteers with associated training and certification for “expert” data collectors (deployed via free Web-based training). This would ensure that on-the-ground teams have at least one certified data collector who is in charge of correctly recording and uploading data.
- Redesign of data collection form. (With more documentation available for what and how each data attribute should be collected.)
Assuming that only the Reactive & Process Focus is followed, there is a limit to how much control and validation can be conducted due to the nature of the data collection medium (paper based). The biggest problem is that errors in data collection are all discovered after-the-fact, making it difficult to correct the data. At best observations could be removed from the analysis set (so as to not bias the final analysis). If a digital data collection method (e.g. using a smartphone or tablet) is used the following methods of data quality control are possible. More specifically, this is where use of the Conformed Dimensions of Data Quality is helpful.
Using the Proactive & Technology Focus computers/tablets/smartphones could be used to collect the data- thereby allowing the data entry application to enforce validation rules when data is collected. Assuming that a mobile device using either a standard Web page data entry or platform specific App (e.g. Apple App and Android App) the following Conformed Dimensions could be programmed into the software in order to ensure that only valid data is collected.
| CDDQ release 3.3 | ||
| Validity | Values in Specified Range | Values must be between some lower number and some higher number. |
| Values Conform to Business Rule | Validity measures whether values adhere to some declarative formula. | |
| Domain of Predefined Values | This is a set of permitted values. | |
| Values Conform to Data Type | Validity measures whether values have a specific characteristic (e.g. Integer, Character, Boolean). Data types restrict what values can exist, the operations that can be use on it, and the way that the data is stored. | |
| Values Conform to Format | Validity measures whether the data are arranged or composed in a predefined way. | |
Additionally, given that most devices are equipped with GPS technology, spatial data collection (and thereby additional validation) could be conducted. This would for instance not only allow LAHSA to collect counts of persons (available today) but know where those counts were made. This provides a much more Precise accounting of the nature of homelessness and enables further services to be deployed to the most appropriate locations. Below is a screenshot of a census track surveyed (534301- part of the City of Cudahy). Using the LAHSA Census Tract finder page, you can get a feel for the size of each area surveyed by volunteers. Click on the image to open another window to see detail.

Using spatial data quality rules- embedded into the App- additional data quality can be ensured. Here are a few that may provide value:
- Logical Consistency- If "People calculated living in cars" is greater than one, then the "Car count" entered should also be greater than one, else ask the volunteer to correct inconsistency or provide note on the reason.
- Temporal Consistency- Survey start time or end time (entered by volunteer) should not be greater than x minutes different from when Deployment Site Coordinator entered via his/her App, else ask the volunteer to correct inconsistency or provide note on the reason.
- Values Conform to Business Rule- More advanced rules (using prior year's data) could flag counts that are significantly higher (aka 2 or 3 standard deviations) than prior year data. This may be allowed, but drive follow-up questions by specialists at the Deployment Location when volunteers return from the survey.
Additional reasons for conducting data collection via smartphones include:
- The App could offer one-touch dial for emergency help (911) or direct to the Deployment Site Coordinator's mobile phone for more benign questions.
- Digital collection of data is generally more efficient- eliminating duplicate work because it doesn't require manual entry later (which may itself cause data quality issues if mis-entered).
- Less paperwork that could be lost or damaged and is generally eco-friendlier.
In Conclusion
I was very impressed with the general survey structure conducted by LAHSA, and hope that future surveys could be done digitally thereby maximizing data quality through the ways discussed in this blog, as well as improving the general precision of data collected. I'm sure many of you (readers) will think of additional ideas for validation and data collection, so please email those to me (dan[at]dqmatters[dot]com), so that I can add post script- adding value to survey administrators and similar organizations around the world.